meta data for this page
このページの翻訳:
- ja
Warning: Undefined array key 1 in /home/c1720449/public_html/medwiki.online/lib/plugins/toctweak/syntax/metatoc.php on line 79
P値関数
-
- 「統計モデル」にはパラメータの値に関する仮説(=帰無仮説もその一種)が含まれる
- P値は「効果=0」という帰無仮説を前提にした統計モデルでなくても計算することができる
- そこで「効果=x」というあらゆる仮説 x におけるP値を関数的に扱って(=P値函数)グラフにplotし,その情報をそのまま読者に提供することが提案されている
- 「統計学的に有意なんて言葉を使うのはやめようよ Retire statistical significance.」のNature誌コメント2)で有名な Valentin Amrhein らが2022年にこのP値函数を推進する論文を発表している3)
- 表題は「点推定値や null P値だけでなく,区間推定値や P値関数に基づいて,結果の実用的な重要性を議論しよう Discuss practical importance of results based on interval estimates and p-value functions, not only on point estimates and null p-values」
- 以下はその論文の導入の文言
One of the most persistent misconceptions about p-values is that they are necessarily calculated assuming a null hypothesis of no effect is true. Instead, p-values can and should be calculated for multiple hypothesized values for the effect size. 「p値に関する最も根強い誤解の1つは,p値は必ず「効果がない」という帰無仮説を仮定して計算されるというものである.そうではなく,効果量に関する複数の仮説に対してp値を計算することができ,また計算すべきである」
Nullismからの脱却
- 「効果がない」という帰無仮説だけを検定するやり方は,“Nullism” と呼ばれる認知・手続き的バイアスの現れである
- これは合理的な代替案も分析することを犠牲にして「効果がない」仮説にばかり過度に焦点を当てるものである
- Nullism は歪んだ科学的報告の広範な原因であると主張されている4).
We view the practice of testing only the null hypothesis of no effect as a manifestation of a cognitive and procedural bias called ‘nullism’, in which excessive focus is made on a ‘no-effect’ hypothesis at the expense of analysing reasonable alternatives as well. It has been argued that nullism is a pervasive source of distorted scientific reporting (Greenland, 2017)
モデルと適合性のよい推定値を一覧する
- 点推定値がまさに「効果なし no effect」に対応する値でない限り,「効果なし(したがって観察された関連は純粋なランダム誤差である)」という仮説(=帰無仮説)は,手元のデータと最も適合する仮説にはならない.
- より大きな P値を持つ他の全ての仮説が,同じ背景モデルにおいて手元のデータによく適合しているはずである.
- 実際に手元にそのもののデータが得られている「点推定値」point estimate こそが最も適合性が高い(P=1.00)
- これは,すべての仮説の P値を互換性グラフ compatibility graph またはp値関数 p-value function(信頼分布 confidence distribution または協和曲線 consonance curve としても知られている)にプロットすればよくわかる
Unless the point estimate has a value exactly corresponding to no effect, the hypothesis of no effect (and thus that any observed association is pure random error) is not the hypothesis that is most compatible with our data. Any other hypothesis with a larger p-value would be more compatible with the same data given the same background model. We can see this by plotting the p-values of all hypotheses in a compatibility graph or p-value function (also known as a confidence distribution or consonance curve; Berner and Amrhein, 2022; Birnbaum, 1961; Cox, 1958; Infanger and Schmidt-Trucksäss, 2019; Poole, 1987; Rafi and Greenland, 2020; Rothman et al., 2008, Ch: 10).
P値関数を要約する値
- null P値,点推定値,信頼区間はいずれも「P値関数」の要約値とみなすことができる
- null P値:帰無仮説「効果=0」を前提にして算出したP値.
- 古典的仮説検定で提示される最もよく知られたP値
- 点推定値 point estimate:手元に得られたデータの代表値(平均,中央値など).
- 実際に得られたデータなので,この値を前提にして算出したP値は「p=1.00」になる(P値函数グラフの頂点)
具体例
- 【CC-BY】Journal of Information Technology Vol37, Issue 3, September 2022,316-320 DOI
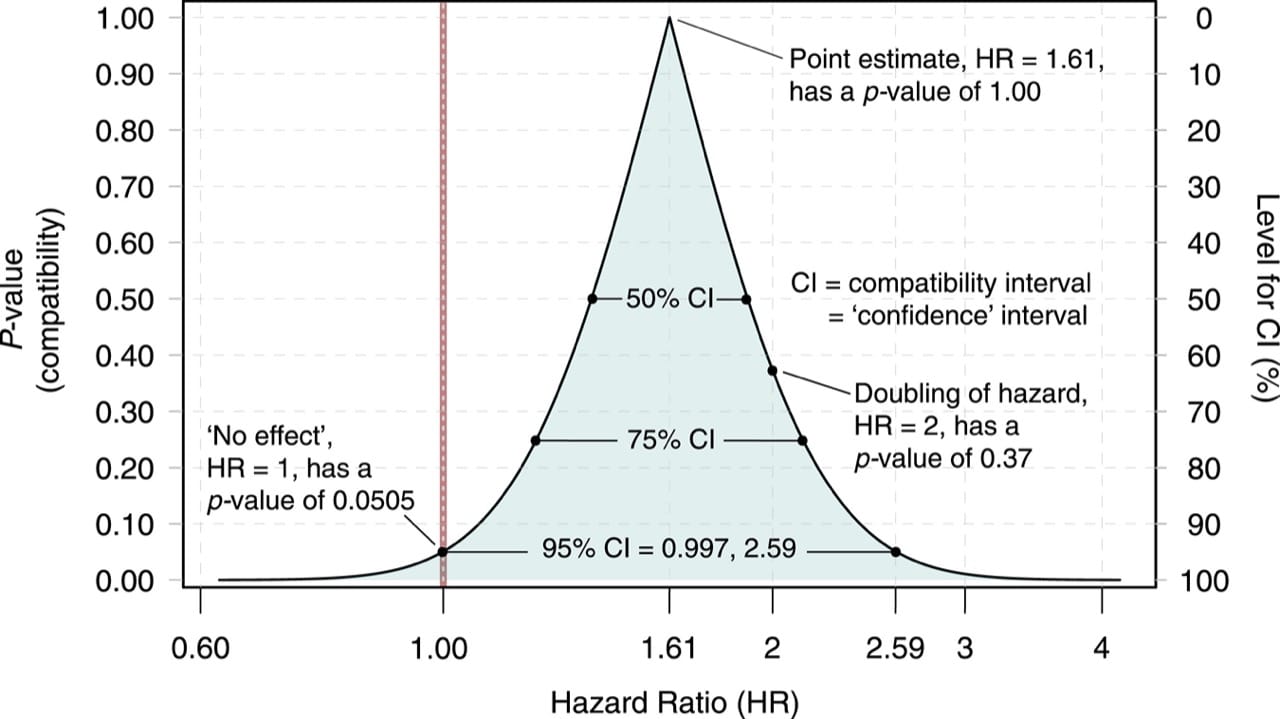
- この図の元データは JAMA 2017 のOA記事 “Association Between Serotonergic Antidepressant Use During Pregnancy and Autism Spectrum Disorder in Children.” 6).そのデータを用いて上記論文筆者らが P値函数のグラフとして plotしたものである
- この論文は後方視コホート研究で,以下のようなデザインと結果であった.
| P | 2002~2010年にカナダのオンタリオ州で公的処方を受けた母親から生まれた子供 |
| E | 母のセロトニン作動系の抗うつ薬内服への曝露 |
| C | 上記への非曝露,または非曝露の兄弟 |
| O | 自閉症スペクトラム障害の発生 |
| 結果 | 自閉症スペクトラム障害の発生率は,抗うつ薬に曝露された小児では1000人年当たり4.51人,曝露されていない小児では1000人年当たり2.03人(群間差 1000人年当たり2.48 [95% CI, 2.33-2.62]; HR 2.16 [95% CI, 1.64-2.86]). 高次元傾向スコア propensity score に基づく治療の逆確率重みづけ IPTW 後の関連は統計学的に有意ではなかった(HR 1.61[95%CI、0.997-2.59]) |
- この論文の結論は “in utero serotonergic antidepressant exposure compared with no exposure was not associated with autism spectrum disorder in the child. Although a causal relationship cannot be ruled out, the previously observed association may be explained by other factors.”
- 「子どもの自閉症スペクトラム障害と関連がなかった。因果関係は否定できないが、以前に観察された関連は他の要因で説明できるかもしれない」となっている
- つまり「統計学的に有意でない(95%信頼区間がハザード比1を跨いでいる)」ということを強調した結論になっているが,果たしてそのような「線引き」は妥当か?
- P値で言えば,HR=1(帰無仮説)をモデルの前提として算出した P値は0.0505だが,HR=2であることを前提として算出したP値は 0.37である.どちらの方がモデルとの compatibility が良いか?といえば,後者である.つまり「HR=1よりはHR=2のほうが統計モデルとの適合性がよい」ということであり,HR=1のモデルでP値が低かったから「差がない」などと結論するのは妥当なのか?という話である(そこまでのことは論文には記載されていないが).
- 統計的に有意かどうかという単純な二項対立に当てはめるのではなく,compatible intervalsの両端,点推定値,null P値の全てをみて総合的な判断を下すことが望ましい.
- またこのP値を算出するにあたり用いたデータ自体がどの程度のバイアスリスクを持ったものか,という議論は当然欠かすことができない.
- いずれにしても,私はこのデータを見て「可能なら避ける」という意思決定が妥当だと感じる
- 尚このP値関数紹介論文7)上では,そうした意思決定の是非については明言が避けられている
5)
compatible intervalsへの改称が提案されている